


What is EV/EBITDA?
EV/EBITDA is a widely used financial ratio that helps investors assess a company’s overall value. “EV” stands for Enterprise Value, while “EBITDA” refers to Earnings Before Interest, Taxes, Depreciation, and Amortization. The EV/EBITDA ratio is commonly used in financial analysis as a valuation metric to compare companies, especially in capital-intensive industries.
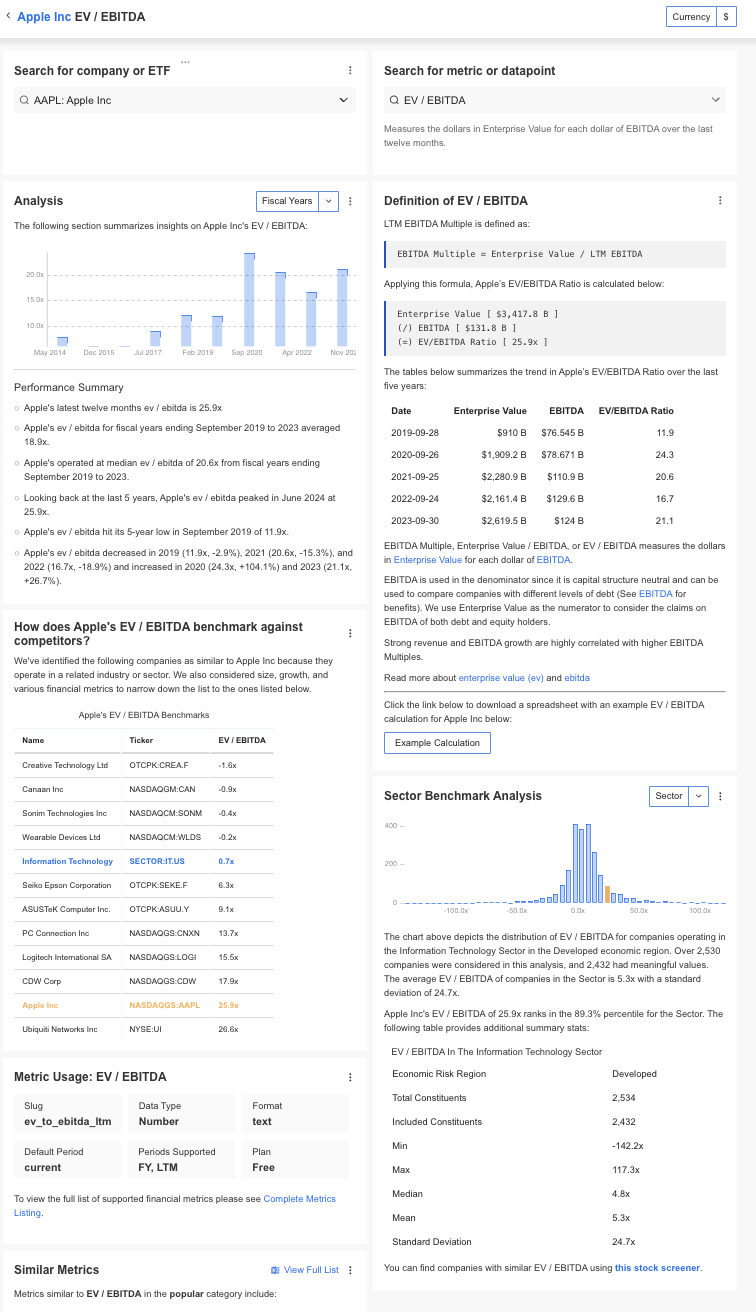
How to Calculate EV/EBITDA Ratio?
To calculate the EV/EBITDA ratio, use the following formula:

EV/EBITDA = Enterprise Value / EBITDA
Here,
Enterprise Value (EV)
Enterprise Value represents the total worth of a company’s operations from the perspective of all its stakeholders, including debt holders and equity shareholders. It essentially reflects what it would cost to acquire the entire business, considering both its debt and equity components.
Enterprise Value (EV) = Market Capitalization + Total Debt – Cash and Cash Equivalents
EBITDA
EBITDA, which stands for Earnings Before Interest, Taxes, Depreciation, and Amortization, is a widely recognized measure of a company’s core operating performance. It is often used as a proxy for unlevered cash flows, providing insight into a business’s profitability before non-operational costs are factored in.
EBITDA = Earnings Before Interest, Taxes, Depreciation, and Amortization

Example Calculation of EV/EBITDA Ratio
Consider a company XYZ has an enterprise value of $500 million and an EBITDA of $50 million.
In this case, its EV/EBITDA would be:
EV/EBITDA = $500 million / $50 million = 10x
Why is EV/EBITDA Ratio Important?
This ratio allows investors to evaluate how much a company is worth relative to its earnings, with a focus on operating performance by excluding non-operational costs. EV/EBITDA is considered useful because it strips out elements like taxes and depreciation, which can vary between companies based on accounting policies or tax regulations.
The financial ratio is favored by analysts for its ability to compare companies regardless of their capital structure, tax rates, or non-cash accounting items. This makes it particularly useful in industries where high capital expenditures or debt levels are common, such as telecommunications, energy, or manufacturing. It provides a clearer picture of operational performance and allows for easier comparison across companies.
How to Interpret EV/EBITDA?
The enterprise multiple, or EV/EBITDA ratio, offers insights into a company’s financial health and valuation. It shows how much investors are willing to pay for each dollar of EBITDA the company generates.
Investors often rely on the EV/EBITDA ratio to assess whether a company is undervalued or overvalued compared to its peers. If a company’s ratio is lower than its competitors or historical averages, it may suggest the company is undervalued. Conversely, a higher ratio could indicate that the company is potentially overvalued.
This metric also helps investors compare a company’s valuation to its peers within the same sector, giving a clearer view of its capital structure and debt levels. For instance, utility companies tend to have different typical ratios compared to those in the consumer discretionary sector, making cross-industry comparisons less meaningful.
Additionally, the EV/EBITDA ratio is a useful tool for spotting potential investment opportunities by identifying companies that may be undervalued or overvalued.
What is a Healthy EV/EBITDA Ratio?
The EV/EBITDA ratio tends to fluctuate across different industries, but for companies within the S&P 500, the average has generally ranged between 13 and 17 in recent years.
As a rule of thumb, an EV/EBITDA ratio below 10 is often viewed favorably by analysts, indicating a potentially undervalued and financially healthy company. However, the most accurate assessment comes from comparing EV/EBITDA ratios within the same industry, as this allows investors to identify companies with stronger relative value and operational efficiency in their sector.
Limitations of EV/EBITDA
While EV/EBITDA is a valuable tool, it has its limitations. The ratio does not account for capital expenditures, which are crucial for companies with significant ongoing investments. Additionally, it may not reflect differences in tax treatments or interest rates, which can impact a company’s financials.
Key drawbacks of the EV/EBITDA Ratio include:
- Lack of Context: The ratio does not account for variations in a company’s growth trajectory, market dynamics, or competitive environment.
- Temporary Influences: It can be swayed by one-time events or changes in accounting practices, as well as fluctuations in interest rates.
- Inapplicability for Certain Companies: The ratio may not be suitable for firms with significant non-cash expenses or inconsistent earnings.
A considerable portion of criticism regarding the EV/EBITDA metric centers around the EBITDA component itself. Many experts contend that EBITDA does not accurately reflect a company’s true cash flow and can sometimes be misleading, particularly for capital-intensive businesses.
Specific concerns include:
- Viewed as an inaccurate gauge of operating cash flow.
- Prone to the effects of accrual accounting and management discretion, despite adjustments for depreciation and amortization.
- Less reliable for capital-intensive sectors, as it fails to account for necessary capital expenditures.
How to Find EV/EBITDA?
InvestingPro offers detailed insights into companies’ EV/EBITDA including sector benchmarks and competitor analysis.
InvestingPro: Access EV/EBITDA Data Instantly
Unlock Premium Data With InvestingPro 📈💸
Gain instant access to EV/EBITDA data within the InvestingPro platform
✓ Access to 1200+ additional fundamental metrics
✓ Competitor comparison tools
✓ Evaluate stocks with 14+ proven financial models
EV/EBITDA Frequently Asked Questions
Q. What is considered a “good” EV/EBITDA ratio?
A lower EV/EBITDA ratio typically suggests that a company is undervalued, while a higher ratio may indicate that it is overvalued. However, what is “good” depends on the industry. A ratio of 10x is often seen as average, but this can vary significantly across sectors.
Q. How does EV/EBITDA compare to other valuation metrics?
EV/EBITDA is preferred over the price-to-earnings (P/E) ratio in some cases because it eliminates the effects of capital structure, making it easier to compare companies with varying levels of debt.
Q. Can EV/EBITDA be negative?
Yes, if a company’s EBITDA is negative, the ratio will also be negative. This generally indicates that the company is facing financial difficulties.
Q. Why exclude depreciation and amortization?
Depreciation and amortization are non-cash charges, which can vary greatly due to accounting choices. By excluding these, EBITDA focuses more on the operational earnings of a company.
Q. Is EV/EBITDA suitable for all industries?
No, EV/EBITDA is most useful in capital-intensive industries where companies have significant depreciation and interest costs. It may not be as relevant for industries with minimal capital expenditures.


