


What is Piotroski Score?
The Piotroski Score, developed by accounting professor Joseph Piotroski, is a financial tool designed to identify value stocks that have strong fundamentals. It is used by investors to evaluate the financial health of a company. The Piotroski Score ranges from 0 to 9, with higher scores indicating better financial health.
How to Calculate the Piotroski Score?
The Piotroski Score is calculated based on nine criteria divided into three main categories – profitability, leverage/liquidity, and operating efficiency. Each criterion is binary, scoring 1 point for a positive result and 0 for a negative result, with a maximum score of 9.
The nine criteria used for calculation are as follows:
Profitability:
- Net Income: Positive net income in the current year scores 1 point.
- Return on Assets (ROA): Positive ROA in the current year scores 1 point.
- Operating Cash Flow (OCF): Positive cash flow from operations scores 1 point.
- Accruals: OCF exceeding net income scores 1 point.
Leverage, Liquidity, and Source of Funds:
- Decrease in Leverage: A lower ratio of long-term debt to total assets compared to the previous year scores 1 point.
- Increase in Current Ratio: A higher current ratio compared to the previous year scores 1 point.
- No New Shares Issued: No new shares issued in the last year scores 1 point.
Operating Efficiency:
- Increase in Gross Margin: A higher gross margin compared to the previous year scores 1 point.
- Increase in Asset Turnover: A higher asset turnover ratio compared to the previous year scores 1 point.
The formula for calculating the Piotroski Score is the sum of the points from these nine criteria:
Piotroski Score = ∑ (Points from 9 criteria)

How to Interpret Piotroski Score?
The Piotroski Score is a valuable tool for investors seeking to identify strong value stocks through fundamental analysis. By assessing profitability, leverage, liquidity, and operational efficiency, the score provides a comprehensive picture of a company’s financial health.
A company that scores between 7 to 9 points is considered to have a strong financial health and of good value, while a score between 0 to 3 indicates potential financial distress, with the company considered as a poor investment.
Limitations of the Piotroski Score
The Piotroski Score comes with certain limitations that investors should be aware of before relying on it for making investment decisions.
Reliance on Historical Data
One of the main drawbacks of the Piotroski Score is its reliance on historical financial data. This approach can be problematic as it does not account for future market dynamics. Changes in the economic environment, industry trends, or shifts in management can significantly impact a company’s performance, and the Piotroski Score may not reflect these factors. Consequently, the score might lead to missed investment opportunities or false positives.
Impact of Unusual Events
The Piotroski Score evaluates a company’s performance based on data from the previous year. This method can be misleading during unusual events, such as the Covid-19 pandemic. For instance, a high-quality stock might receive a low score due to temporary setbacks during such periods. Conversely, a company might score high following a rebound year, which may not indicate long-term strength.
Limited Usefulness for Cyclical Stocks
Cyclical stocks, which are subject to fluctuations based on economic cycles, may not be accurately assessed by the Piotroski Score. The score could show these stocks in a negative light during downturns, even if they are fundamentally strong. Similarly, during economic upswings, cyclical stocks might receive inflated scores that do not reflect their overall volatility.
Challenges with Micro-Cap Stocks
The Piotroski Score is not particularly effective for evaluating micro-cap stocks, which have a market capitalization below ₹500 crore. These stocks often lack liquidity compared to small-cap, mid-cap, or large-cap stocks, and their financial metrics can be more volatile. As a result, even quality micro-cap stocks might receive low or negative scores, making the Piotroski Score less reliable in this segment.
How to Find the Piotroski Score?
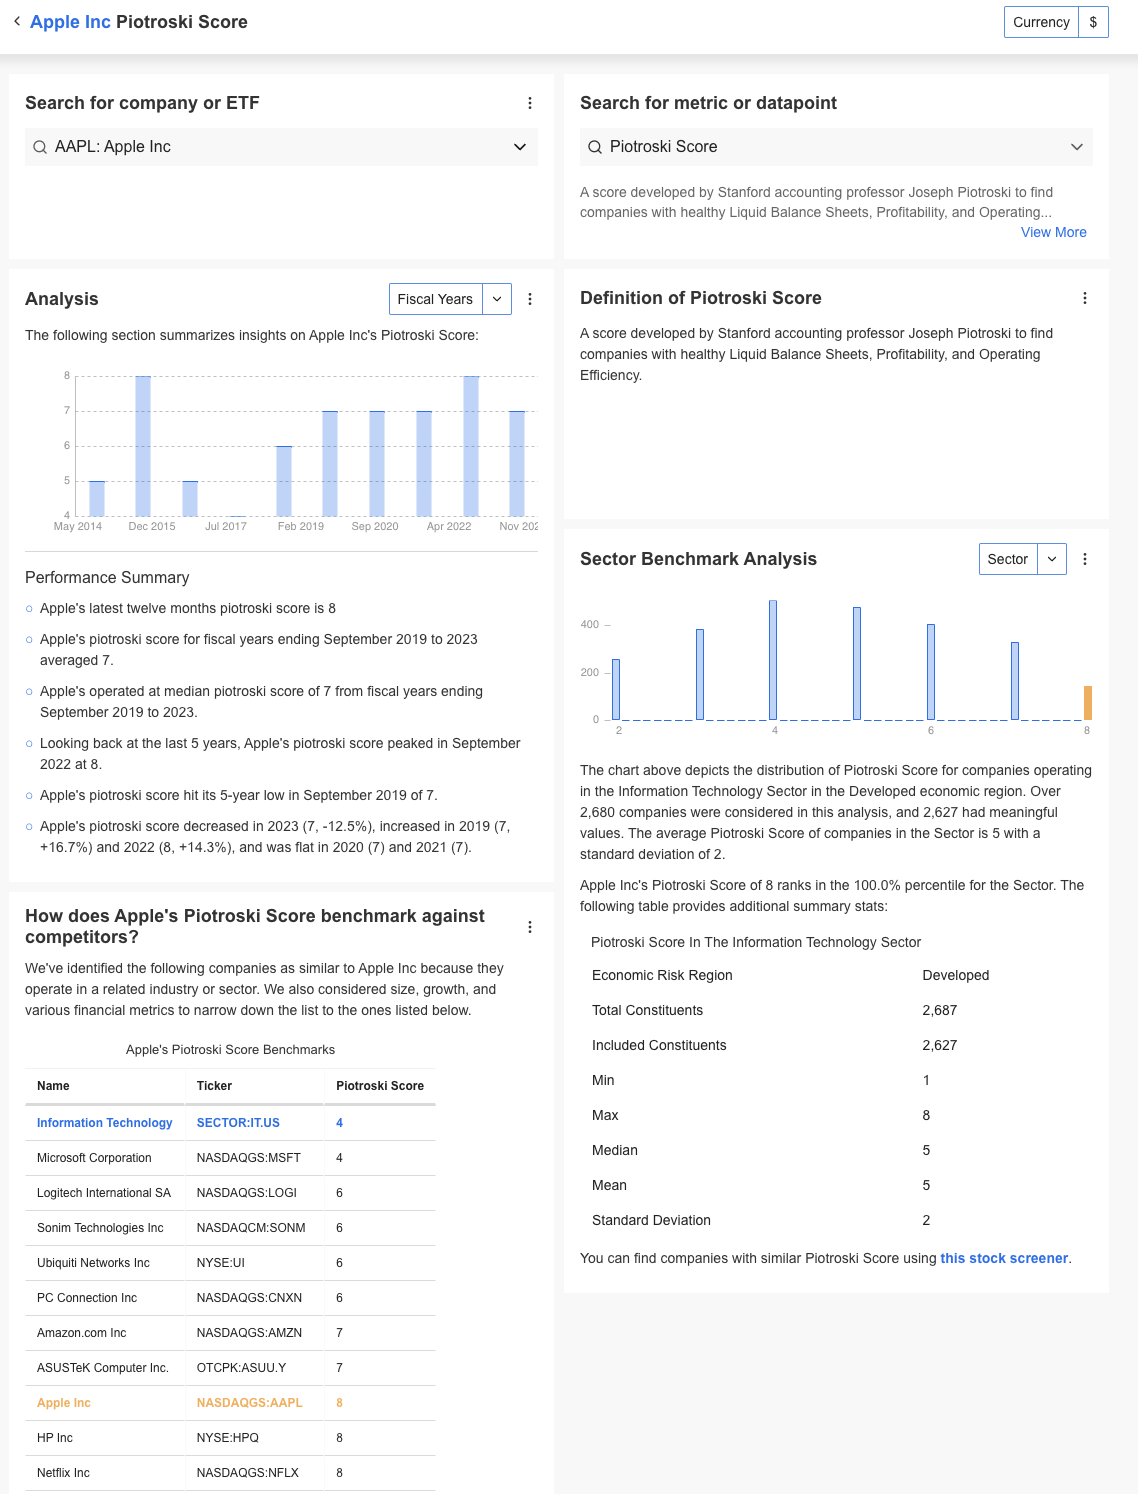
InvestingPro offers detailed insights into companies’ Piotroski Score including sector benchmarks and competitor analysis.
InvestingPro: Access Piotroski Score Data Instantly
Unlock Premium Data With InvestingPro 📈💸
Gain instant access to Piotroski Score data within the InvestingPro platform
✓ Access to 1200+ additional fundamental metrics
✓ Competitor comparison tools
✓ Evaluate stocks with 14+ proven financial models
FAQ
What is the Piotroski Score used for?
The Piotroski Score is used to evaluate the financial health of value stocks, helping investors identify potentially strong investments based on fundamental analysis.
How does the Piotroski Score benefit investors?
By focusing on specific financial criteria, the Piotroski Score helps investors filter out companies with weak fundamentals and highlight those with strong financial stability and growth potential.
Can the Piotroski Score predict stock performance?
While the Piotroski Score can indicate a company’s financial health, it should be used in conjunction with other analyses and not as the sole predictor of stock performance.
Is the Piotroski Score applicable to all industries?
The score is most effective for evaluating manufacturing and similar industries where financial metrics like inventory levels and gross margins are significant. It may be less effective for service-based or high-tech industries.


