- English (UK)
- English (India)
- English (Canada)
- English (Australia)
- English (South Africa)
- English (Philippines)
- English (Nigeria)
- Deutsch
- Español (España)
- Español (México)
- Français
- Italiano
- Nederlands
- Polski
- Português (Portugal)
- Português (Brasil)
- Русский
- Türkçe
- العربية
- Ελληνικά
- Svenska
- Suomi
- עברית
- 日本語
- 한국어
- 简体中文
- 繁體中文
- Bahasa Indonesia
- Bahasa Melayu
- ไทย
- Tiếng Việt
- हिंदी

Cenovus Energy Inc (CVE)
Cenovus Energy Inc stock price live, this page displays TSX CVE stock exchange data. View the CVE premarket stock price ahead of the market session or assess the after hours quote. Monitor the latest movements within the Cenovus Energy Inc real time stock price chart below.
What Is the Cenovus Energy Inc Stock Price Today?
The Cenovus Energy Inc stock price today is 25.635.
What Is the Stock Symbol for Cenovus Energy Inc?
The stock ticker symbol for Cenovus Energy Inc is CVE.
Is CVE the Same as $CVE?
$CVE is a common way to refer to the Cenovus Energy Inc ticker symbol in social media, forums, and online discussions. The dollar sign is a shorthand convention used to indicate that it is a stock ticker symbol
What Stock Exchange Does Cenovus Energy Inc Trade On?
Cenovus Energy Inc is listed and trades on the Toronto stock exchange.
Is Cenovus Energy Inc a Good Stock to Buy?
Determining whether Cenovus Energy Inc—or any stock—is a good buy requires comprehensive analysis. To evaluate its potential, users can sign up to InvestingPro, where they can assess the current Cenovus Energy Inc share price compared with the fair value and other essential metrics.
You can find more details by visiting the additional pages to view historical data, charts, latest news, analysis or visit the forum to view opinions on the CVE quote. (ISIN: CA15135U1093)
Currency in USD
25.615
-0.105(-0.41%)
Real-time Data·
Fair Value
An estimate of a stock's true price based on valuation models like discounted cash flow, peer valuation multiples, and dividend discount models.
Day's Range
25.390
25.825
52 wk Range
11.360
27.650
Earnings results expected in 15 days
1/2
Fair Value
An estimate of a stock's true price based on valuation models like discounted cash flow, peer valuation multiples, and dividend discount models.
Day's Range
25.39025.825
52 wk Range
11.36027.650
Key Statistics
Edit
Prev. Close
Open
Volume
Average Vol. (3m)
1-Year Change
Book Value / Share
Fair Value
Fair Value Upside
Market Cap
Shares Outstanding
Revenue
Net Income
EPS
EPS Growth Forecast
Next Earnings Date
(2.28%)
Dividends Payment Streak
P/E Ratio
Return on Assets
Return on Equity
Gross Profit Margin
Price/Book
EBITDA
EV/EBITDA
Beta
CVE Scorecard
Company’s Health
Assesses a company's financial position by analyzing its market value, financial ratios, industry benchmarks, and competitors.
UnlockFair Value
An estimate of a stock's true price based on valuation models like discounted cash flow, peer valuation multiples, and dividend discount models.
Unlock PriceTechnical Analysis
Neutral
Analysts Sentiment
Currently not supported.
Members' Sentiments
Bearish
Bullish
ProTips
Tips that distill complex financial data into concise, actionable investment insights.
Has maintained dividend payments for 18 consecutive years
- Cenovus Energy receives Investment Bank Analyst Rating Update
- Investing.com
Pro
- Cenovus Energy receives Investment Bank Analyst Rating Update
- Investing.com
Pro - Form 6K CENOVUS ENERGY INC. For: 1 April
- Investing.com
Technical Analysis
Summary
Strong Sell
Sell
Neutral
Buy
Strong Buy
Strong Sell
Technical Indicators
Strong Sell
Moving Averages
Strong Sell
Cenovus Energy Inc., together with its subsidiaries, develops, produces, refines, transports, and markets crude oil, natural gas, and refined petroleum products in Canada, the United States, and China. It operates through Upstream and Downstream segments. The company is involved in the development and production of bitumen and heavy oil; owns and operates pipeline gathering systems and terminals; operation of assets rich in NGLs and natural gas in Alberta and British Columbia; and offshore operations, exploration, and development activities in the East Coast of Canada and the Asia Pacific region. It also engages in refining, such as owned and operated Lloydminster upgrading and asphalt refining complex; owns and operates the Bruderheim crude-by-rail terminal and two ethanol plants; fuels business; and refining of crude oil to produce gasoline, diesel, jet fuel, asphalt, and other products. Cenovus Energy Inc. was founded in 2009 and is headquartered in Calgary, Canada.
Cenovus Energy Inc SWOT Analysis
Market Valuation | Analysts project higher mid-cycle free cash flow by 2026, with an average price target of $26.50, suggesting potential upside for investors |
Growth Prospects | Delve into Cenovus's potential to benefit from Alberta's ambitious oil production plans, balanced against pipeline capacity constraints |
Operational Challenges | Explore the persistent issues in Cenovus's US refining segment and their impact on quarterly results, despite impressive upstream performance |
Financial Resilience | Cenovus Energy maintains a "GOOD" financial health score, with a strong balance sheet providing stability and flexibility in a volatile market |
Cenovus Energy Inc Earnings Call Summary for Q2/2025
- Cenovus Energy generated $2.1B in operating margin in Q2 2025, reduced net debt to $4.9B, and returned $819M to shareholders despite a slight stock decline of 0.44%
- Operational achievements included first oil at Narrows Lake, increased steam capacity at Foster Creek, and completion of the West White Rose project
- The company plans to reduce capital expenditures to approximately $4B in 2026 while targeting 10% growth in cold heavy oil production
- CEO Jon McKenzie expressed optimism following a six-quarter maintenance cycle, emphasizing the company's focus on maximizing free cash flow
- Management anticipates tight heavy oil differentials due to the TMX pipeline, with West White Rose expected to generate $800M in free cash flow by 2028-2029
Last Updated: 10/30/2025, 02:12 PM
Read Full TranscriptCenovus Energy Inc investor slides for Q2/2025
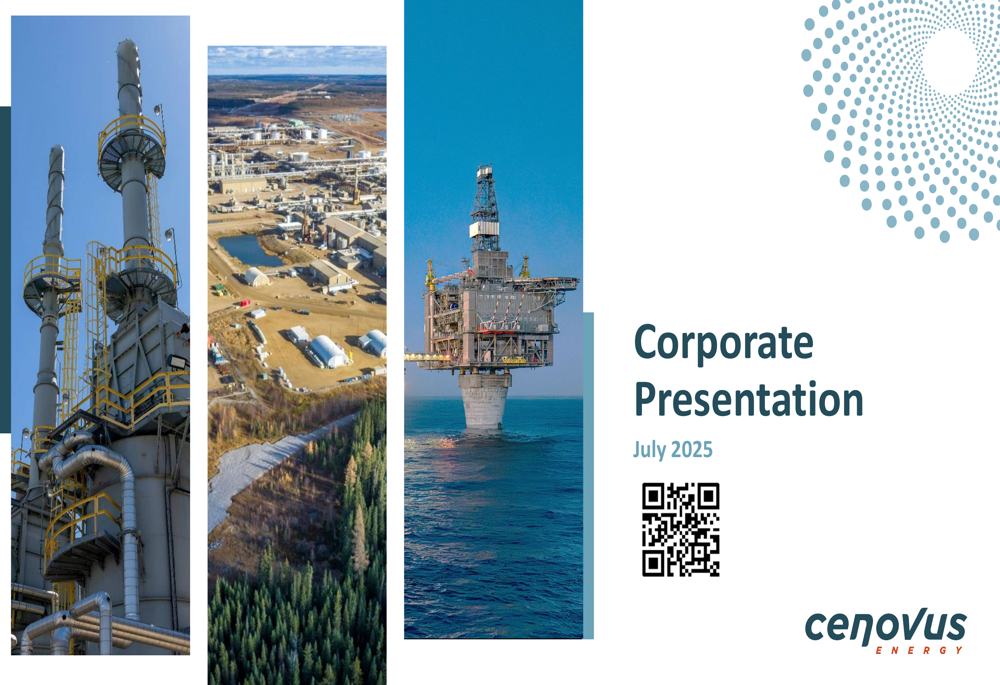
Last Update: Oct 30, 2025
See full investor slides
Compare CVE to Peers and Sector
Metrics to compare | CVE | Sector Sector - Average of metrics from a broad group of related Energy sector companies | Relationship RelationshipCVEPeersSector | |
|---|---|---|---|---|
P/E Ratio | 16.9x | 23.3x | 6.9x | |
PEG Ratio | 0.59 | 0.12 | 0.00 | |
Price / Book | 2.1x | 2.3x | 1.1x | |
Price / LTM Sales | 1.3x | 1.8x | 1.5x | |
Upside (Analyst Target) | 9.2% | 5.2% | 16.1% | |
Fair Value Upside | Unlock | −2.9% | 4.8% | Unlock |
Earnings
Latest Release
Feb 19, 2026
EPS / Forecast
0.37 / 0.28
Revenue / Forecast
9.45B / 8.63B
People Also Watch
Install Our App
Risk Disclosure: Trading in financial instruments and/or cryptocurrencies involves high risks including the risk of losing some, or all, of your investment amount, and may not be suitable for all investors. Prices of cryptocurrencies are extremely volatile and may be affected by external factors such as financial, regulatory or political events. Trading on margin increases the financial risks.
Before deciding to trade in financial instrument or cryptocurrencies you should be fully informed of the risks and costs associated with trading the financial markets, carefully consider your investment objectives, level of experience, and risk appetite, and seek professional advice where needed.
Fusion Media would like to remind you that the data contained in this website is not necessarily real-time nor accurate. The data and prices on the website are not necessarily provided by any market or exchange, but may be provided by market makers, and so prices may not be accurate and may differ from the actual price at any given market, meaning prices are indicative and not appropriate for trading purposes. Fusion Media and any provider of the data contained in this website will not accept liability for any loss or damage as a result of your trading, or your reliance on the information contained within this website.
It is prohibited to use, store, reproduce, display, modify, transmit or distribute the data contained in this website without the explicit prior written permission of Fusion Media and/or the data provider. All intellectual property rights are reserved by the providers and/or the exchange providing the data contained in this website.
Fusion Media may be compensated by the advertisers that appear on the website, based on your interaction with the advertisements or advertisers.
© 2007-2026 - Fusion Media Limited. All Rights Reserved.